
Data visualization · hackathon
Crime.io
A geospatial exploration of crime data built with Python and Streamlit; the project placed third in a hackathon.
Visual evidence
Visual evidence03
The question
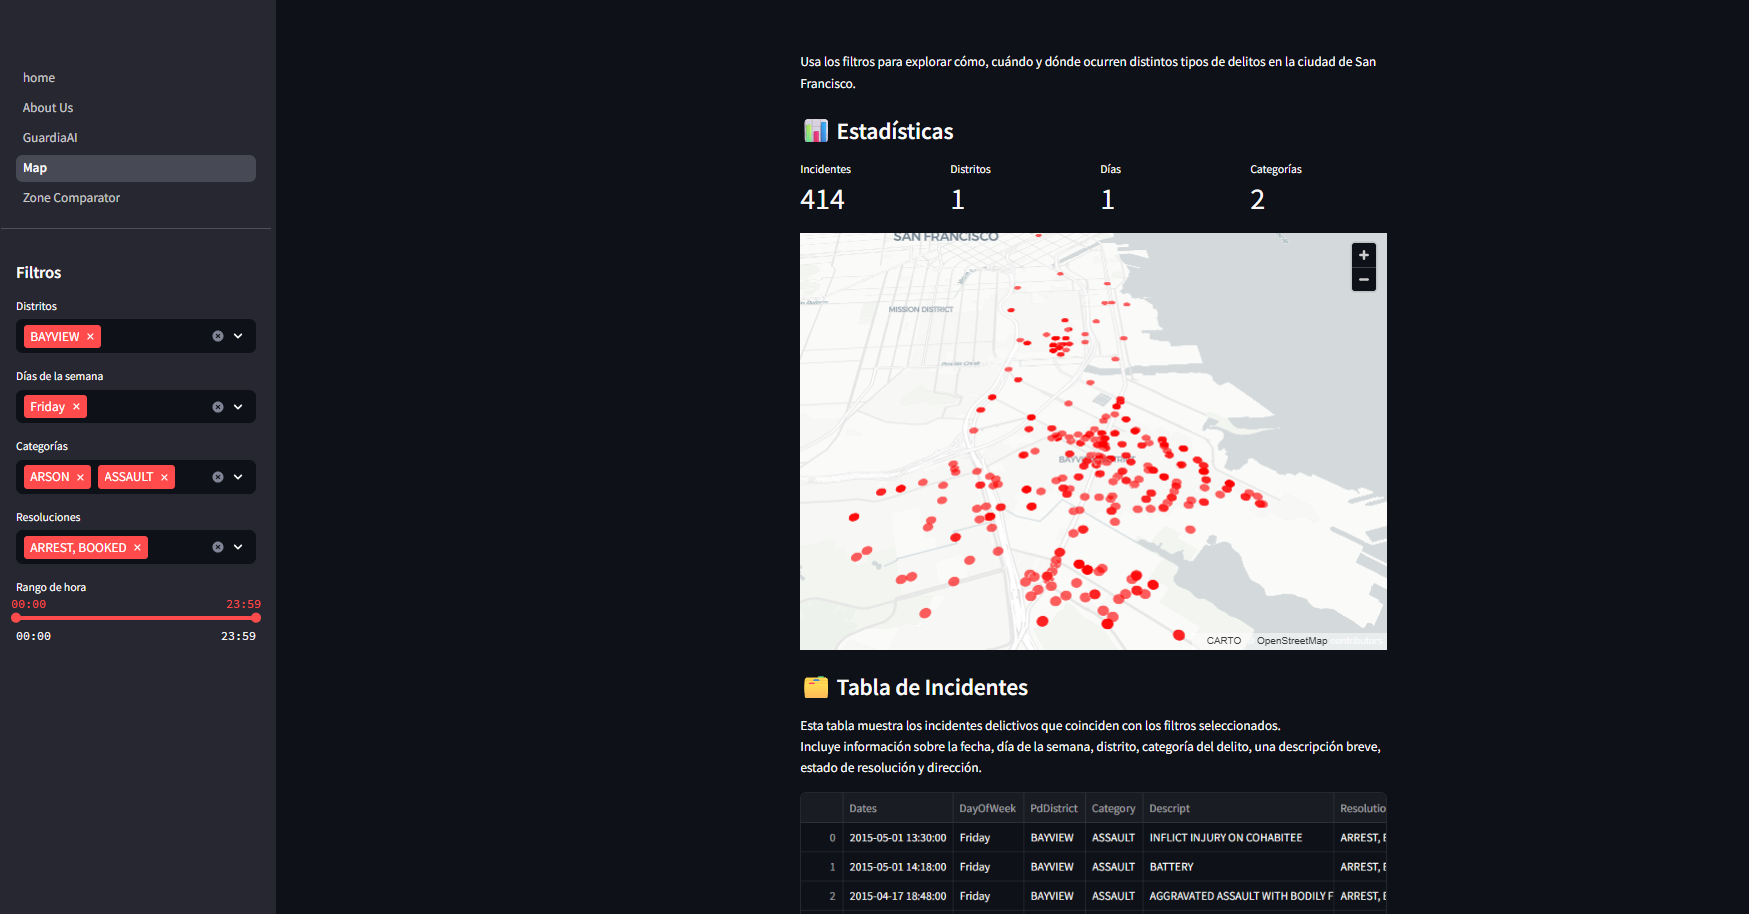
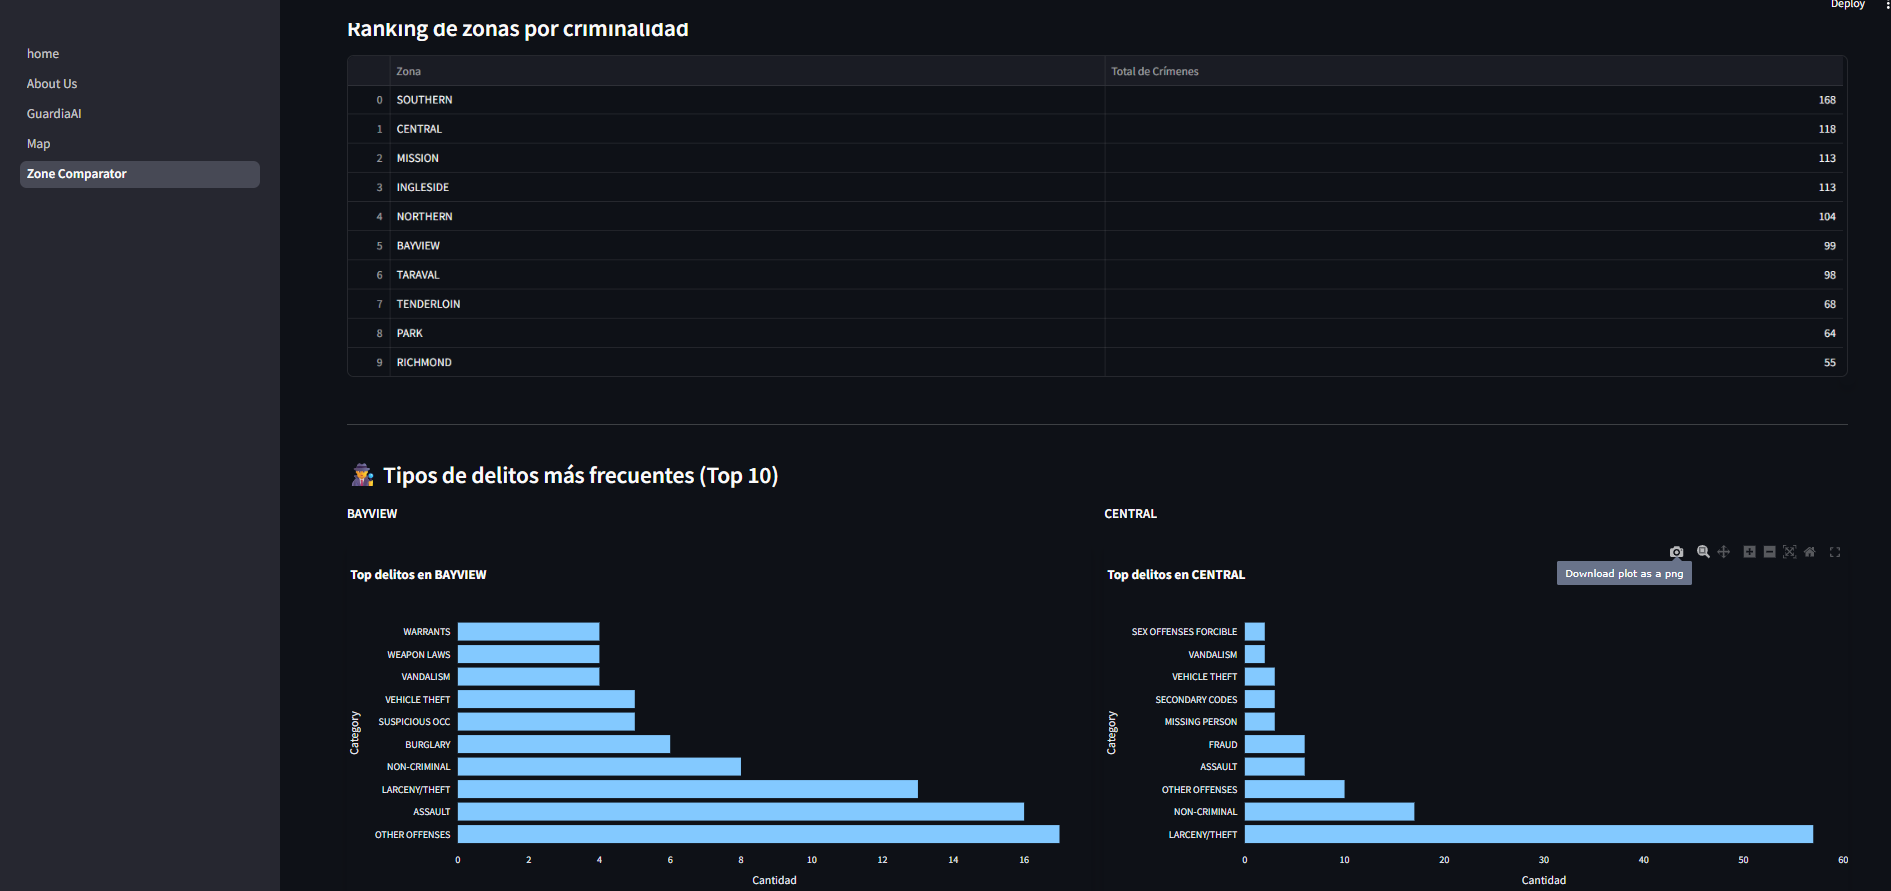
How can isolated records become a spatial reading that helps identify patterns and compare areas?
The build
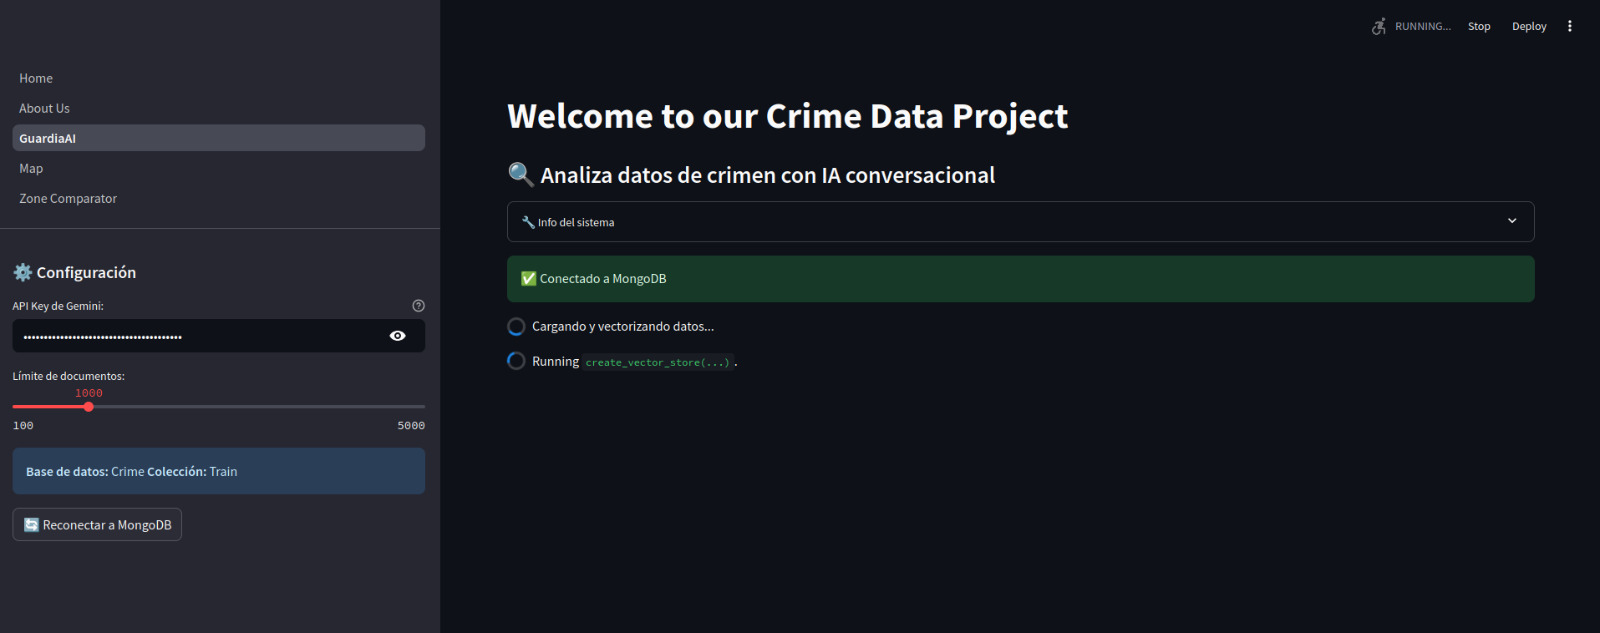
The project prepares and explores data with Pandas and NumPy, then uses Streamlit and Folium to turn it into an interactive mapping experience.
The result
The solution placed third. The public repository preserves the technical process and makes it possible to review decisions made under a real time constraint.
Key decisions
- Turn tabular records into a geographic reading.
- Separate data preparation from interactive presentation.
- Choose tools that supported iteration within the event window.
Verifiable outcomes
- Third place in the hackathon.
- Visual exploration of geographic patterns.
- Public repository for technical inspection.